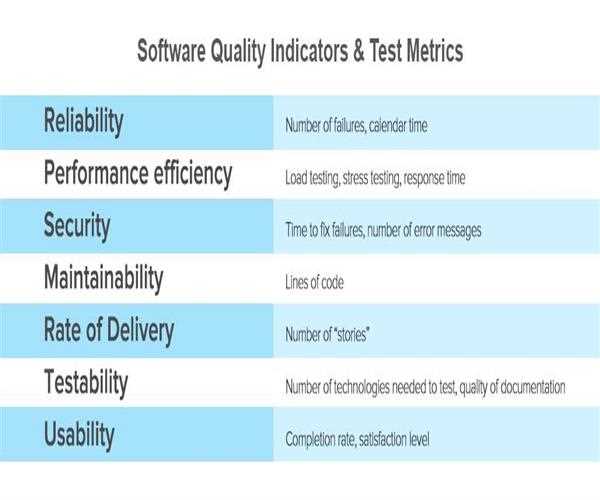
This article deals with the Product Quality Measures for testing
- Customer satisfaction index
- Delivered defect quantities
- Responsiveness (turnaround time) to users
- Product volatility
- Defect ratios
- Defect removal efficiency
- Complexity of delivered product
- Test coverage
- Cost of defects
- Costs of quality activities
- Re-work
- Reliability and Metrics for Evaluating Application System Testing.
Customer satisfaction index
- This index is surveyed before product delivery and after product delivery.The following are analyzed:
- Number of system enhancement requests per year
- Number of maintenance fix requests per year
- User friendliness: call volume to customer service hotline
- User friendliness: training time per new user
- Number of product recalls or fix releases (software vendors)
- Number of production re-runs (in-house information systems groups)
Delivered defect quantities
They are normalized per function point (or per LOC) at product delivery (first 3 months or first year of operation) or Ongoing (per year of operation) by level of severity, by category or cause, e.g.: requirements defect, design defect, code defect, documentation/on-line help defect, defect introduced by fixes, etc.
Responsiveness (turnaround time) to users
- Turnaround time for defect fixes, by level of severity
- Time for minor vs. major enhancements; actual vs. planned elapsed time
Product volatility
Ratio of maintenance fixes (to repair the system & bring it into compliance with specifications), vs. enhancement requests (requests by users to enhance or change functionality)
Defect ratios
- Defects found after product delivery per function point.
- Defects found after product delivery per LOC
- Pre-delivery defects: annual post-delivery defects
- Defects per function point of the system modifications
Defect removal efficiency
- Number of post-release defects (found by clients in field operation), categorized by level of severity
- Ratio of defects found internally prior to release (via inspections and testing), as a percentage of all defects
- All defects include defects found internally plus externally (by customers) in the first year after product delivery
Complexity of delivered product
- McCabe's cyclomatic complexity counts across the system
- Halstead’s measure
- Card's design complexity measures
- Predicted defects and maintenance costs, based on complexity measures
Test coverage
- Breadth of functional coverage
- Percentage of paths, branches or conditions that were actually tested
- Percentage by criticality level: perceived level of risk of paths
- The ratio of the number of detected faults to the number of predicted faults.
Cost of defects
- Business losses per defect that occurs during operation
- Business interruption costs; costs of work-around
- Lost sales and lost goodwill
- Litigation costs resulting from defects
- Annual maintenance cost (per function point)
- Annual operating cost (per function point)
- Measurable damage to your boss's career
Costs of quality activities
- Costs of reviews, inspections and preventive measures
- Costs of test planning and preparation
- Costs of test execution, defect tracking, version and change control
- Costs of diagnostics, debugging and fixing
- Costs of tools and tool support
- Costs of test case library maintenance
- Costs of testing & QA education associated with the product
- Costs of monitoring and oversight by the QA organization (if separate from the development and test organizations)
Re-work
- Re-work effort (hours, as a percentage of the original coding hours)
- Re-worked LOC (source lines of code, as a percentage of the total delivered LOC)
- Re-worked software components (as a percentage of the total delivered components)
Reliability
- Availability (percentage of time a system is available, versus the time the system is needed to be available)
- Mean time between failure (MTBF).
- Man time to repair (MTTR)
- Reliability ratio (MTBF / MTTR)
- Number of product recalls or fix releases
- Number of production re-runs as a ratio of production runs


Leave a Comment