Working with a chart in C#
Here, In this article, I am trying to make a small demo and explain the concept of a chart in C#.
Chart
The chart is a graphical representation of data, charts allow users to see what the result of various data is to better understand and predict current and future data.
Steps for creating a demo project:-
- Create a new project New >> Project (give the appropriate name of the project).
- Now by default show a form1, in form1 drag and drop a datagridview where add the information for a chart.
- After added datagridview drag and drop the chart from the toolbox.
- After adding chart Goto on its property and click on the series property open its dialog box and rename the series (I rename the series into StudentScore).

- Now double click on the form1 and get the form load event.
- After getting form load event write the code in the form load event.
 private void Form2_Load(object sender, EventArgs e)
 {
 try
 {
 dataGridView1.Rows.Add("alex stewart", 24, 56);
 dataGridView1.Rows.Add("chris harris", 34, 76);
 dataGridView1.Rows.Add("frank smith", 21, 46);
 dataGridView1.Rows.Add("henry paul", 27, 66);
 dataGridView1.Rows.Add("lan bishop", 31, 59);
 for (int i = 0; i < dataGridView1.Rows.Count - 1; i++)
 {                  this.chart1.Series["StudentScore"].Points.AddXY(dataGridView1.Rows[i].Cells[0].Value.ToString(), Convert.ToInt32(dataGridView1.Rows[i].Cells[2].Value.ToString()));
 }
 }
 catch (Exception ex)
 {
 MessageBox.Show("something is wrong");
 }
 }
Code Description:-
- This is a form load event.
- To 9. Add data in datagridview.
- This is for loop it will run while datagridview rows count.
- This line of code will add data in a chart from datagridview.
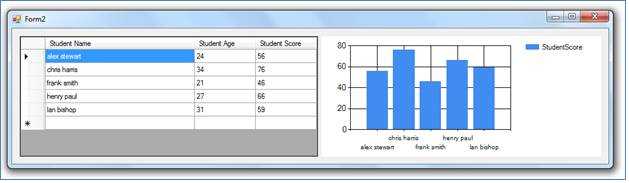
Output:-
You should also read this Article - Search Functionality in ASP.NET MVC 4


Leave a Comment